How to Make a Bar Chart in PowerPoint
1. How to Make a Bar Chart in PowerPoint
The bar chart is a type of representation that allows comparison between two or multiple groups based on a particular parameter. The data is represented in the form of bars. The height of the bars increases with the increase in the value.
While it decreases with its lowering. There are two axes required to present a value with the help of bar graphs. If you want to make a bar chart in PowerPoint, you can use the following steps:
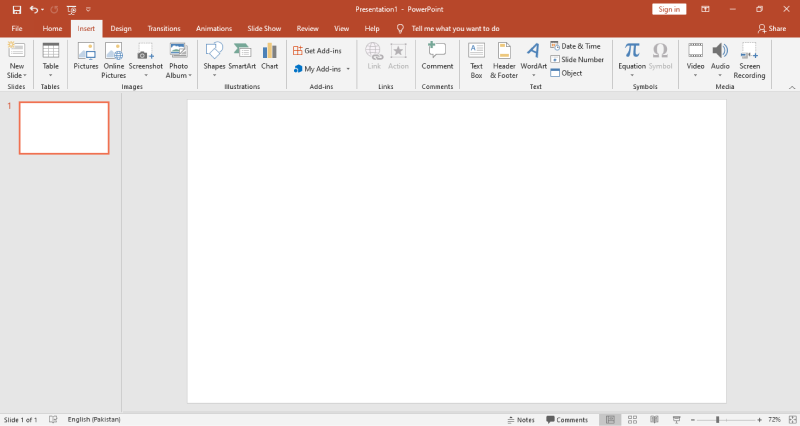
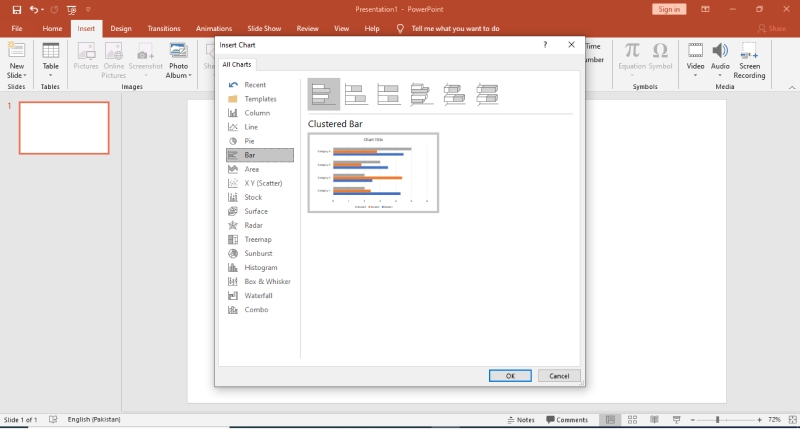
Step 1: Insert The Bar Chart
Before inserting a bar graph into the slide, select the particular slide you want to add to the bar chart. After that, you need to click on the Insert Tab from the Tab bars. Then you can click on the Chart button present in the Illustration section. After you click on the Chart tab, a dialogue box will appear. Here you can select the bar chart as the type of chart from the list.
Step 2: Drag the Category Tab
To get a pie chart on the blank sheet, you need to go to the Dimension section and drag the Category tab to the Colors Marks card. Then you have to move the Sales Tab from the Measures section to the first size Marks card and then to the Label Marks. Once you drag the Sales Tab to Size and Label, there will be values showing on the Pie Chart.
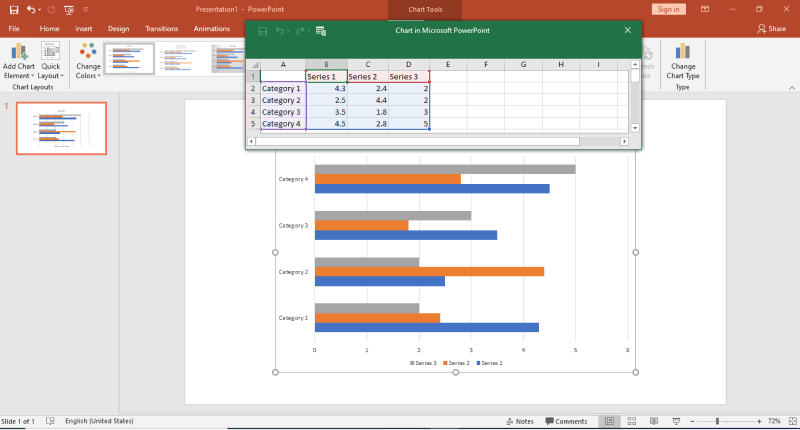
Step 3: Create your bar graph in the PowerPoint
Once the bar chart opens in the slide, you can edit the template as per your choice. Add or edit the categories present in the chart. You have to change the categories' values by clicking on the boxes under series columns. To add more bar series or change the names of the series, you can click on the columns in the editor box. Once your editing is done and finalized, you can save the PowerPoint presentation.
Bar charts help in comparing multiple objects with the help of two axes. You can use PowerPoint to create a bar graph, but the process is lengthy and time-consuming. You must use high-quality templates on the EdrawMax online tool to create a bar chart as per your requirements.
1.1 The Advantages of Making a Bar Chart in PowerPoint
A bar graph is a graph that graphically illustrates categorical data with rectangular bars with heights or lengths proportional to the values that they present. There are a couple of advantages of making abar graph on PowerPoint. For instance:
- Since PowerPoint is a presentation tool, you can easily present your bar graph analysis to your team.
- Several third-party companies offer a variety of PowerPoint bar graph templates, allowing you to create the bar graph easily.
- Auto color changing feature of PowerPoint allows you to create great-looking bar graphs.
1.2 The Disadvantages of Making a Bar Chart in PowerPoint
PowerPoint is a presentation tool and not a drawing tool. So, it comes with several limitations when opting for it to make a bar chart in PowerPoint. There are some disadvantages of making a bar graph in PowerPoint, like:
- It has fewer bar graph templates readily available.
- You cannot merge two or more different kinds of graph diagrams into one.
- Bar graphs created in PowerPoint will only be accessed in Microsoft tools.
1.3 Tips for Making a Bar Chart in PowerPoint
If you are using PowerPoint to make a bar chart, there are certain tips that you should follow in order to create your bar graph easily:
- Correctly label your X-Axis and Y-Axis.
- Increase font sizes, so they are easy to read.
- Remove the legend and add data labels.
2. How to Make a Bar Chart Online Easier
There is a tool EdrawMax Online that shorten your time to create a bar chart. Also, it contains substantial bar chart templates in product and template community that you can use immediately and create chart without efforts.
The best part is that EdrawMax Online can also be accessed online, letting you work seamlessly on any platform. With simple drag and drop options, you can also create visually appealing bar chart via EdrawMax Online in the following way:
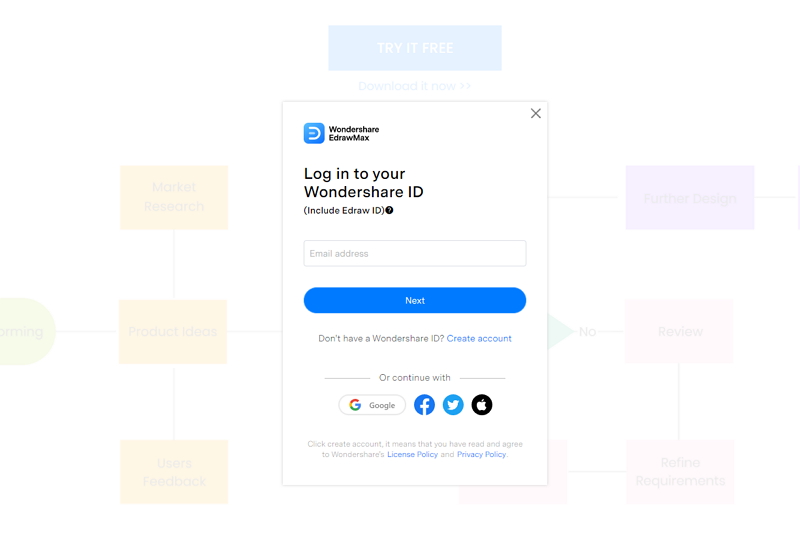
Step 1: Sign In EdrawMax Online
First of all, you need to log in to your EdrawMax Online account. If you haven't used EdrawMax Online before, you can sign up for a free account with your email address. Then you can use EdrawMax Online for free.
 Source:EdrawMax Online
Step 2: Click Blank Drawing or Find a Template
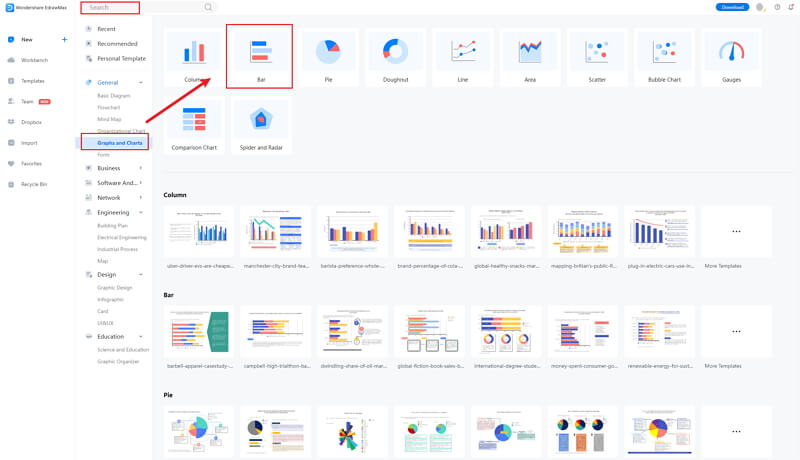
After you log in to your account, find the General tab in the menu. Click the New tab, and the menu will open. From the New list, select the Graphs and Charts tab. When you click the Graphs and Charts tab, the panel will show up in the side window.
From the Graphs and Charts menu, select the Bar tab, and some bar chart templates and Create New tab (large + sign) will appear on the below panel. You can create a bar chart using a template or make a graph chart from scratch.
 Source:EdrawMax Online
Step 3: Modify Your Chart
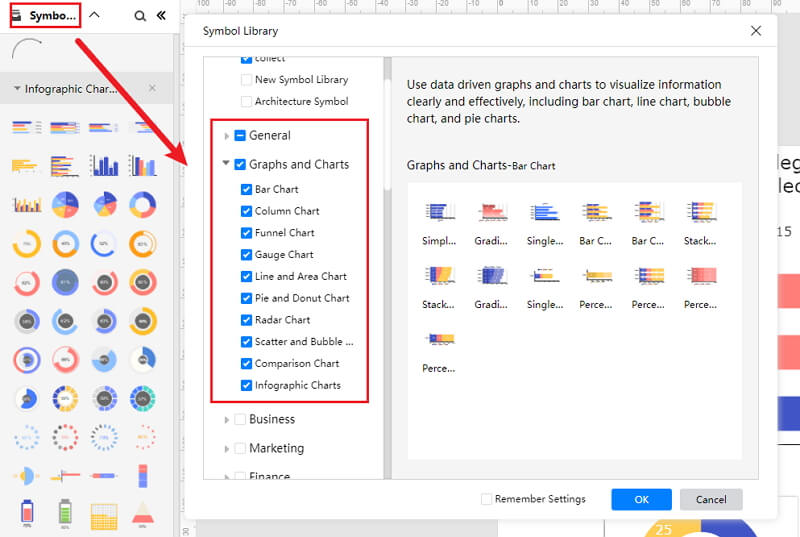
When you click the large + sign, the editor window will open. You need to find bar chart from the Symbol Library, there are many themes for bar charts.
Click the Symbol Library option on the top left side of the editor window. Next, a dialogue box will open. From the dialogue box, go to the Chart menu. A pop-up menu for bar chart symbol categories will appear. Then, mark the Bar Chart tab, click the OK button to import the bar graph in the editor window.
Or you can import the data from your end, and the bar chart will be made automatically.
 Source:EdrawMax Online
Step 4: Add More Details to Complete Chart
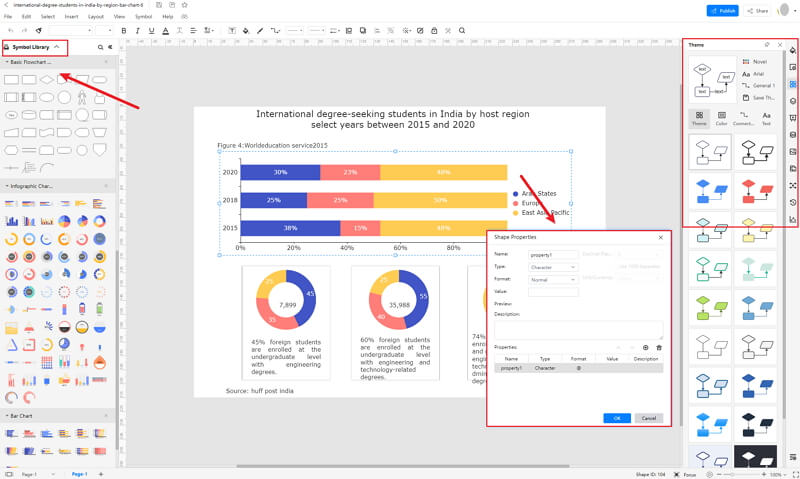
Once the symbols are imported to the editor window, you can drag and drop the bar chart symbols in the editor to create your bar graph using them. To edit the symbol, click in the boxes and enter your content. Likewise, you can make the boxes more attractive by using the Fill, Line, and Shadow options.
There are many editing options available in EdrawMax Online to make sure your bar graph is customized according to your needs. You can change the transparency, change, type of fill, as well as add and remove layers.
f you want to change the graph type, go to the Attributes pane, and then click the Change Type option. To edit the series and categories of the data, go to the Data pane, and an editor window will open where you can input your data. You can add more series and categories as well as edit the different values against the series and categories.
 Source:EdrawMax Online
Step 5: Export Bar Chart as PowerPoint
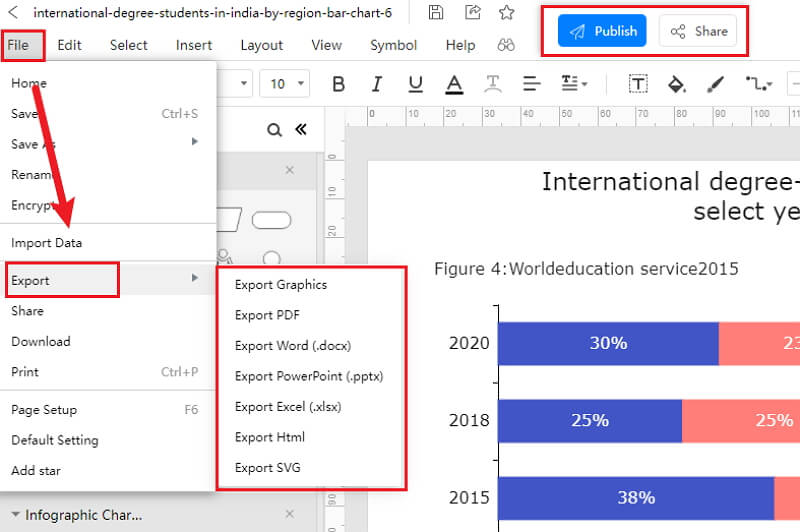
Click on File in the top left corner, from the drop-down menu select Export. From the Export menu, select Export to PowerPoint (.pptx), and your Edraw bar chart will be saved as a PowerPoint file to your computer. Also, you can export as Graphic format, and attached the image in the PowerPoint.
If you are still wondering how to make a bar chart in EdrawMax Online, you can check this bar chart guide for reference.
 Source:EdrawMax Online
2.1 The Advantages of Making Bar Graph in EdrawMax Online
Compared with PowerPoint, there are many advantages that making a bar graph in EdrawMax Online:
- EdrawMax Online supports to make a bar graph online, and will be automatically saved, which means you could make charts in any where at any time.
- EdrawMax Online has a powerful Template Community, that you can find inspirations from thousands of templates made by Edraw users.
- EdrawMax Online supports to export and import multiple file formats, which ensures that you can make continue your work from other platform to EdrawMax Online, or you can export your bar graph from EdrawMax Online, and attached to other files.
- Or even you can showoff your bar graph with others by using Presentation Mode.
2.2 The Disadvantages of Making Bar Graph in EdrawMax Online
Even though there are some advantages of using EdrawMax Online as the tool to create your bar graph, certain limitations affect the overall quality of the project. For instance:
- EdrawMax Online contains limited six sigma related symbols. However, it is good for you to make your own bar graph symbols, you can create symbols from EdrawMax, or you can import the symbols you like and save into your symbol libraries for later use.
2.3 Tips for Making Bar Graph in EdrawMax Online
Creating bar graph in EdrawMax Online could be easier thing than making in PowerPoint, since there are resources and powerful export function.
- Choose a built-in template from Template Community to start quickly.
- Use powerful toolbars on the right and left sides of canvas to make your bar graph more stunning.
- Export your bar graph in mulitple formats to meet your needs, or share to your social media, email, and print it out.
3. PowerPoint Bar Chart Templates
The followings are the bar graph PowerPoint templates, you can refer to them, or even use them immediately with ease.There are more bar chart examples offered to give you inspirations and you can use immediately.
PowerPoint Bar Chart
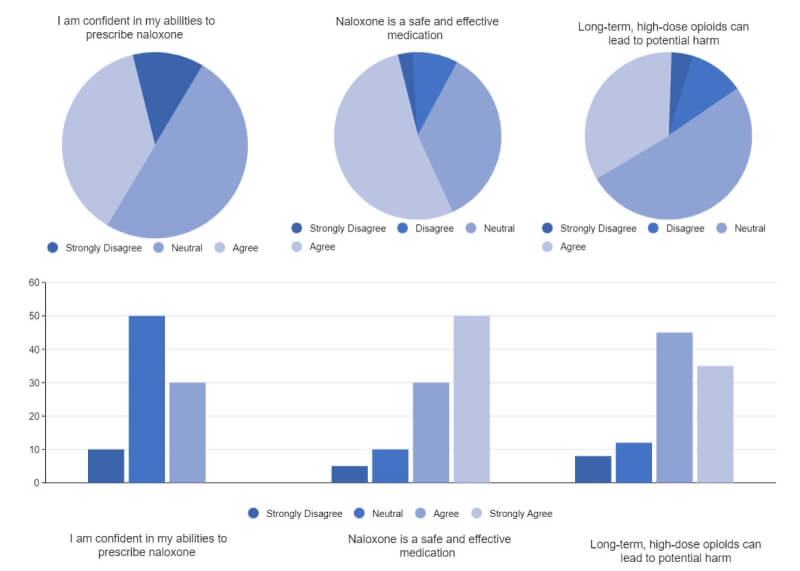
The following bar graph template also has multiple Pie Charts. As we can see from the graphical illustration of the categorical data, we have analyzed the advantages and disadvantages of different medications. As illustrated in the bar graph template below, long-term & high-dose opioids can lead to potential harm.
Whereas, Naloxone is a safe and effective medication to use. At the same time, the person who has analyzed the data seems confident enough in their abilities to prescribe Naloxone to their patients. You can use Pie Charts and bar graphs to represent your findings visually.
Source:EdrawMax Online
Bar Chart Template
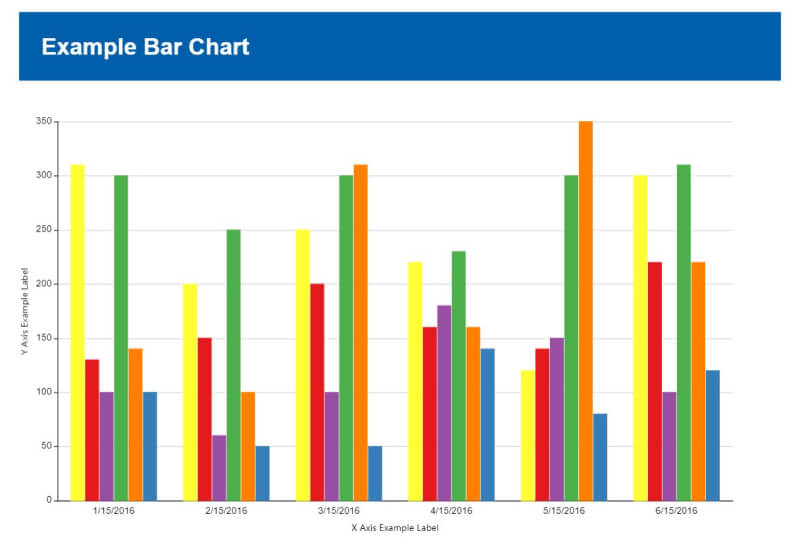
The following bar graph shows X-Axis and Y-Axis and the data placed in it accordingly. Instead of using bar graphs or Bar Charts from scratch, you can start using EdrawMax Online, which comes with free bar graphs templates and other diagram elements. All you have to do is enter the data in the X-Axis table and the Y-Axis table, and with just one click, your bar graph will be ready to present.
As you can see here, the following bar graph template showcases X-Axis and Y-Axis changes depending upon different months and years. With EdrawMax, you can also change the color of each of the bars, ensuring that you or your team can easily differentiate between multiple findings.
Source:EdrawMax Online
Segmented Bar Chart
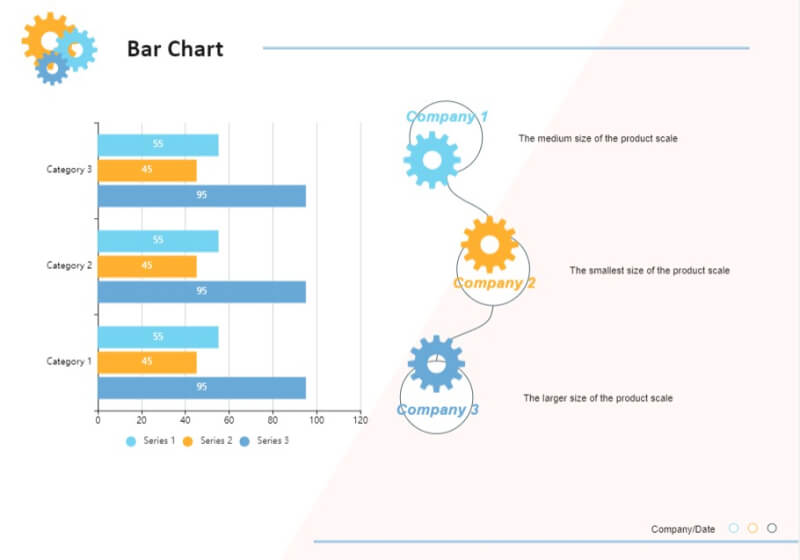
The following bar graph helps visualize the distribution of different data points across different subgroups of your data. As you can see here, we have examined which groups are the most common or highest on a bar chart and how other groups might be related to one another. Such bar graphs can be employed in different scenarios to illustrate the categorical data across two different verticals.
The bar graph template below is presented to you by EdrawMax Online. You can also use EdrawMax Online to create bar graphs for your usage. These free bar graph templates are 100% customizable, letting you easily customize them as per your brand.
Source: EdrawMax Online
4. EdrawMax Online Features
EdrawMax Online is a free online bar chart maker, which meets what you need for your professional usage if you are looking for dedicated chart-making software. With EdrawMax Online, you can add the data manually into the sheet so that the graph will change and get shaped accordingly. At the same time, you can also use the import feature of this all-in-one tool to browse the local files from your system, which has data in the required format to make a bar graph.
- There are thousands of design elements in EdrawMax Online that can help you create 280+ different types of diagrams.
- You can also browse its extensive range of templates in Template Communityand can readily customize them as per your requirements.
- EdrawMax Online is a free cross-platform tool that you can access on any browser and use without any prior designing experience.
- There are dedicated features to customize your diagrams and export them in numerous formats like PNG, PDF, TIFF, SVG, and more.
EdrawMax Online comes with several different chart templates, like Comparison Graphs, Infographic Bars, and Comparison List, allowing you more flexibility and robustness.
5. Key Takeaways
Even though PowerPoint can be your go-to tool for your presentation work, you cannot rely on it when it comes to creating bar graphs to illustrate your data categorically. For performing such detailed analysis, you need EdrawMax Online, which lets you import all the data right from your system or Google Drive.
Moreover, PowerPoint will only let you create and design one set of bar graphs. Nevertheless, with EdrawMax Online, you can create grouped bar graph, horizontal bar graph, stacked bar graph, and more.


