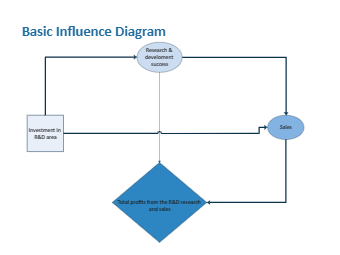
basic influence diagram, which illustrates how the business operates from investment to the final making profits. Since it is a simple influence diagram, the information has been visualized and easy to understand. The flowchart depicts the steps as various types of boxes, with arrows linking the boxes in a logical order. A solution model for a particular problem is depicted in this diagrammatic representation. Flowcharts are used in a variety of industries to analyze, create, document, and manage a process or program.