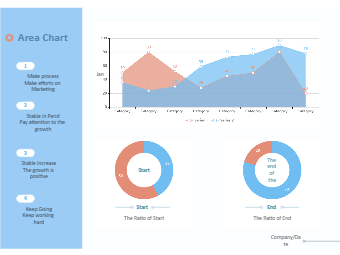
An area chart represents the change in one or more quantities over time. It is made by plotting a series of data points over time, connecting those data points with line segments, and then filling in the area between the line and the x-axis with color or shading. If you want to display how values change over time, use area charts.
When the total is as important as the shares, area charts work best.
When there are significant variances between your values, area charts perform well.
When displaying multiple data over time, area charts perform best.


 Desktop