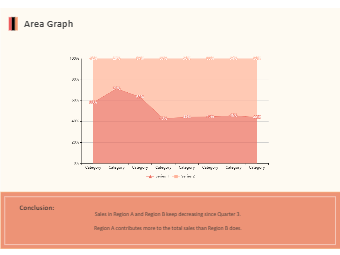
Area Graphs are Line Graphs but with the area below the line filled in with a certain colour or texture. Area graphs, like line graphs, are used to show the evolution of quantitative values over a period of time. Rather of conveying exact values, they are most commonly used to depict patterns. clustered and stacked Area Graphs are two popular types of Area Graphs.


 Desktop