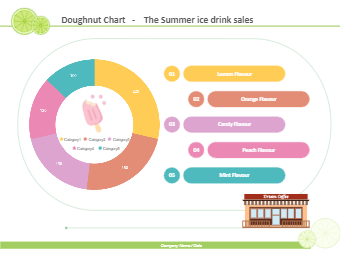
Pie and doughnut charts are effectively the same class in Chart. It is but have one different default value - their cutoutPercentage. Donut charts are used to show the proportions of categorical data, with the size of each piece representing the proportion of each category. A donut chart is created using a string field and a count of features, number, or rate/ratio field. Use EdrawMax to create this diagram and other 280+ types of diagrams. You can find more diagram templates from the template gallery, and you can also start creating graphs with 26,000+ vector symbols.