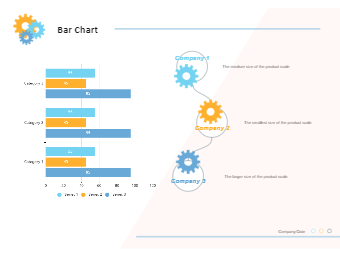
A Bar Graph (also called Bar Chart) is a graphical display of data using bars of different heights. When you wish to demonstrate a distribution of data points or compare metric values across different subgroups of your data, a bar chart is employed. We can examine which groups are the most common or highest on a bar chart, as well as how other groups relate to one other. Use EdrawMax to create this diagram and other 280+ types of diagrams. You can find more diagram templates from the template gallery, and you can also start creating graphs with 26,000+ vector symbols.


 Desktop