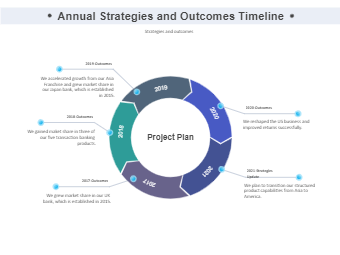
Here is an example of the annual strategies and outcomes timeline, which shows how the strategies in this year. A timeline chart refers to a chart that displays a list of events in the order in which they occurred. Timeline charts are often used to help students and researchers to understand the order or chronology of historical events and trends for a subject.


 Desktop