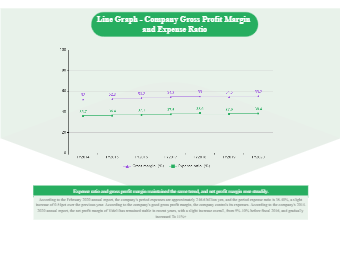
The line chart describes the changes in the gross profit margin and expense ratio of company in the past 6 years from 2014 to 2020, and summarizes the changes. It can be seen from the line chart that the expense ratio and gross profit margin generally follow an upward trend, the expense ratio and the gross profit margin maintain the same trend, and the net profit margin is steadily rising. According to the February 2020 annual report, the company's period expenses are approximately 246.6 billion yen, and the period expense ratio is 38.40%, check more details from this line graph.