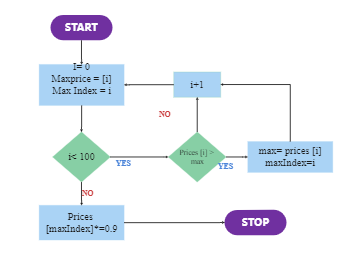
Here is an algorithm flowchart about finding the largest price, from which the max price is represented by i, then compare the price between i and 100. A flowchart is easy to show the algorithm relations, and visualize the links or the relationship among numbers. It is usually used in the Math and relative subject research, which helps to simplify the complex mathmatic questions. Check this flowchart, and learn more in this template gallery.