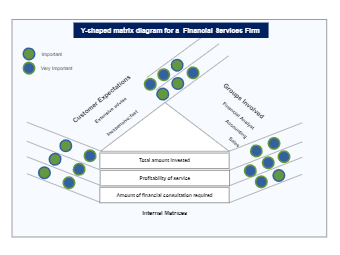
This is a Y-Shaped Matrix diagram. The basic Y-Shaped Matrix Diagram typically shows the critical relationships of three groups of items in a kind of circular flow. In this example, the Y-shaped matrix diagram is used by a financial services firm that specializes in managing the investments of relatively small investors (that is, less than $10 million). The managing partner wants to illustrate the firm’s internal metrics compared to the customer’s expectations compared to the groups involved in the service delivery. For more examples, please check out our edrawMax template gallery.