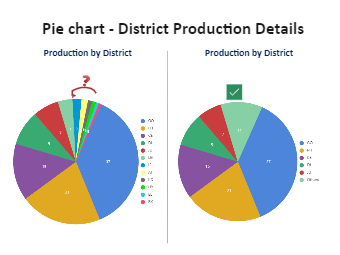
This Template of ‘Pie Chart - District-wise Production Details’, shows the details of the production of different products concerning District-wise data. And when these District-wise Production Details are represented through a Pie chart, it is very easy to understand and compare the District wise production data. Pie charts with a more number of slices can be difficult to read. It can be difficult to see the smallest slices, and it can be difficult to choose enough colors to make all of the slices distinct, so here Legends are provided right side of Pie chart for a clear representation of data. As we know, Pie charts are one of the most public types of data visualizations. A pie chart expresses a part-to-whole relationship in your data. It is a type of graph that displays data in a circular graph.


 Desktop