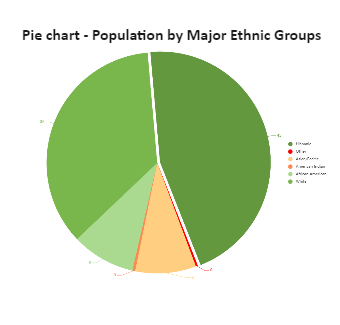
This Template of ‘Pie chart - Population by Major Ethnic Groups, Southern California’, shows the details of population distribution. And when you want to represent the data related to the Population of a particular Major Ethnic group in a place or country, a pictorial representation of this Pie Chart will help us to present and visualize the data better. it is very easy to understand and compare the order amount data in a Pie chart with labels indicating the percentage of data out of total data and legends are also provided to see the different major ethnic groups. Legends can be edited in the data tab, and we can add or remove the data fields easily to customize as per our need. As we know, Pie charts are one of the most public types of data visualizations based on requirements. A pie chart expresses a part-to-whole relationship in your data. It is a type of graph that displays data in a circular graph.