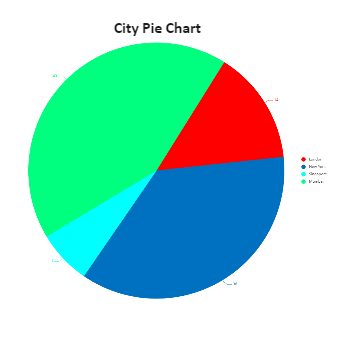
This Template of ‘City Pie Chart’, shows the data regarding the demographic and population density data of the four most happening cities around the world. We know that these four cities London, New York, Singapore, and Mumbai are having wonderful opportunities for people from various corners of the world, here in this Pie chart the data is represented visually and compared. A pie is a chart that represents data in a form of a circle divided into triangular wedges called slices. Each slice represents a percentage that corresponds to a particular value. The default view of a pie chart includes the pie with the labels and the chart legend. The values of the labels are retrieved from the name field of data.


 Desktop