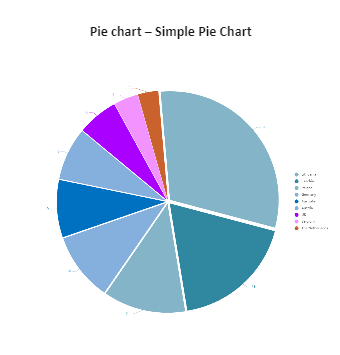
This Template of ‘Pie chart – Simple Pie Chart’, reflects the data of different countries and compares the same with others. A pie is a chart that represents data in a form of a circle divided into triangular wedges called slices. Each slice represents a percentage that corresponds to a particular value. The default view of a pie chart includes the pie with the labels and the chart legend. The values of the labels are retrieved from the name field of data. We can manage the appearance of the labels by using options in the Properties tab very easily. We can edit the data with the additional city name or we can delete the entry from the data tab.