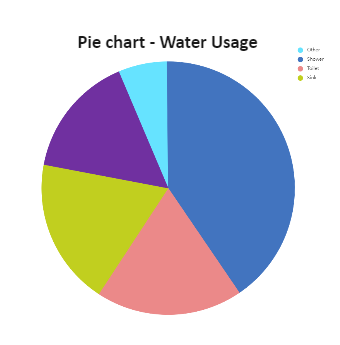
Pie charts are one of the most public types of data visualizations. A pie chart expresses a part-to-whole relationship in your data. It is a type of graph that displays data in a circular graph. The pieces of the graph are proportional to the fraction of the whole in each category. In other words, each slice of the pie is relative to the size of that category in the group as a whole. The entire “pie” represents 100 percent of a whole, while the pie “slices” represent portions of the whole. The pie charts give information about the water used for residential, industrial and agricultural purposes in any Apartment, or city. It is noticeable that more water is consumed by homes than by industry or agriculture. By contrast, agriculture accounts for the vast majority of water used worldwide.


 Desktop