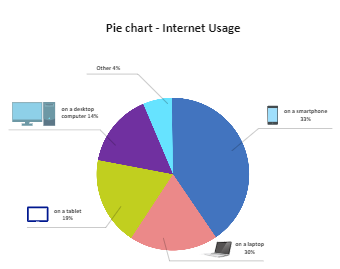
Pie charts are one of the most public types of data visualizations. A pie chart expresses a part-to-whole relationship in your data. It is a type of graph that displays data in a circular graph. The pieces of the graph are proportional to the fraction of the whole in each category. In other words, each slice of the pie is relative to the size of that category in the group as a whole. The entire “pie” represents 100 percent of a whole, while the pie “slices” represents portions of the whole. One of the key changes over this decade is the transition from conventional televisions to flat-screens, people are more interested in accessing the internet with mobile, laptop, tablet, etc., Another general trend is that younger people are now watching television on smaller, more portable devices than in 2010.