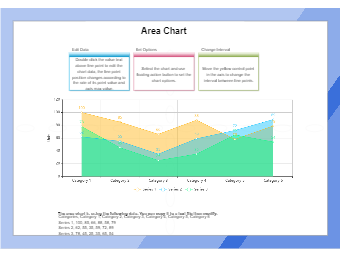
An Area Chart combines the line chart and bars chart to show how more than one categories’ numeric value changes over the progression of a second variable, typically that of time. An Area Chart or Area Graph displays graphically quantitative data. In the attached diagram, the area between axis and line is emphasized with colors, textures, and hatchings. This Area Chart depicts several categories and units, and how it changes over a particular interval. In an overlapping area chart, we usually start with a standard line chart where one point is plotted at each horizontal value with height indicating the group’s value on the vertical axis variable; a line connects all of the categories’ points from left to right.