
Template Community /
Editable Fishbone Diagram Template
Editable Fishbone Diagram Template
Kiraaaa
Published on 2021-03-23

1. Introduction
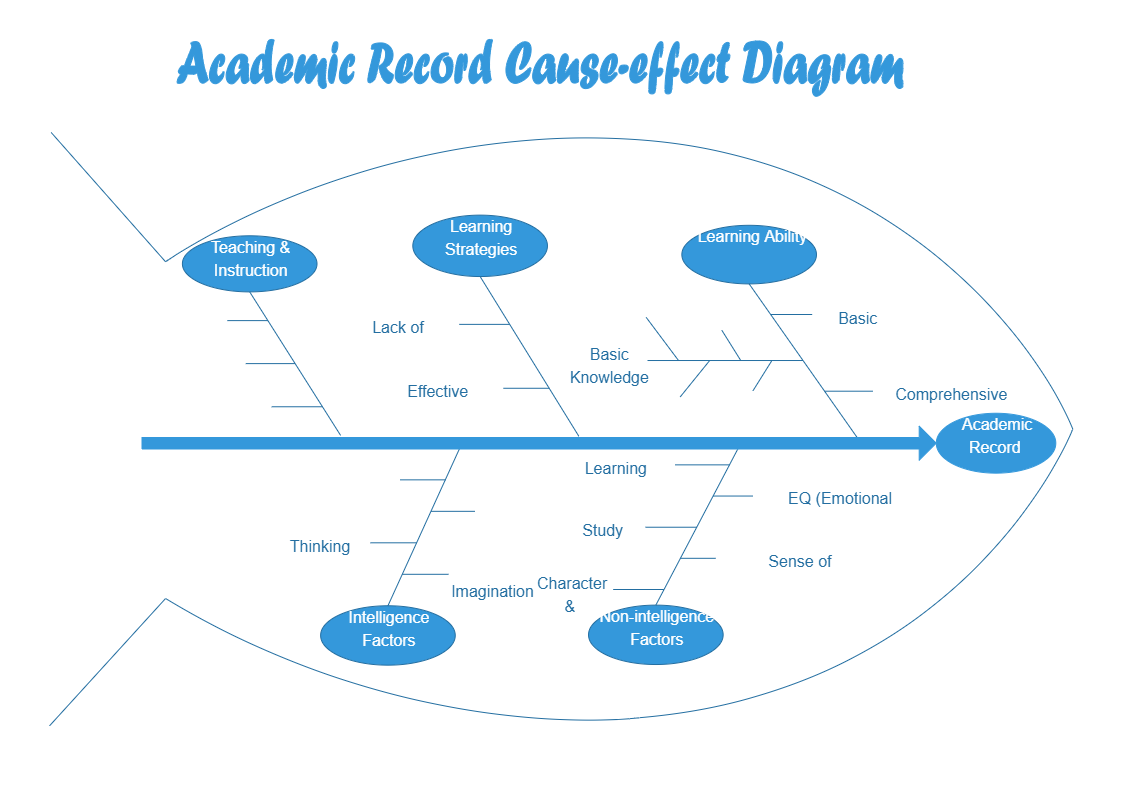
An Academic Record Fishbone diagram illustrates how teaching, learning strategies, learning abilities, non-intelligence factors, and intelligence factors improve a student’s learning. As highlighted in the Academic Record Fishbone diagram, the EQ, interests, strategies, and parents are crucial for a children’s academic improvement.
2. What is Fishbone Diagram
A fishbone diagram, also known as an Ishikawa diagram or a cause-and-effect diagram, is a method for visualizing all of the possible causes of an issue in order to find the fundamental reasons. The fishbone diagram aids in the grouping of various factors and provides a framework for displaying them. When used appropriately, it ensures that you address the root of the problem rather than just implementing a band-aid remedy.
3. When to Use a Fishbone Diagram
The fishbone diagram was created as a tool to aid in problem-solving, but it is significantly more adaptable than that. The fishbone diagram can be used to break down all of the contributing variables in a hierarchical fashion for any process or system. Use cases for the fishbone diagram include the following:
- An examination of a problem statement
- To come up with a list of the problem's causes (root cause analysis)
- To investigate a new design
- Process enhancement
- Increasing the level of quality
3. How to Create a Fishbone Diagram
Step 1: Identify the issue
The right definition of the problem is the first step in solving any problem and the key to a good fishbone diagram. In this case, a product's turnover rate is high.
Step 2: Make a list of the major factors.
After the problem has been adequately characterized, the next step is to determine which aspects of the problem or process are crucial in establishing the root cause.
Step 3: Identify the root causes of the issue.
Now that the categories have been defined, we will go over each one and try to identify all of the individual elements that may have an impact on our output.
Tag
fishbone
Fishbone Diagram Collection
Share
Report
12
1.1k

Post
Recommended Templates
Loading
