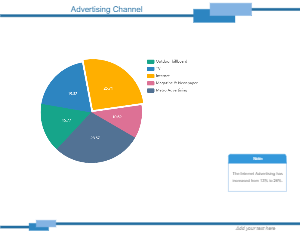
A pie chart is a type of graph that represents the data in a circular graph. A Pie Chart is a type of pictorial representation of data as it requires a list of categorical variables and numeral variables. As shown in the following pie chart diagram, an organization can understand which advertising channel is currently trending in the market. An Advertising Channel Pie Chart here shows that internet advertising has increased from 13 percent to 26 percent in recent times, making it one of the most profitable channels to market any product. However, advertising channels like outboard billboards and magazines only have an 18 percent and 11 percent growth rate. A Pie Chart can be created using online or offline tools like EdrawMax and can be accessed to get an immediate idea of the relative sizes of the groups or the categories.


 Desktop