
Template Community /
Flowchart Infographic
Flowchart Infographic
Lisa Anderson
Published on 2021-03-26

1. Introduction
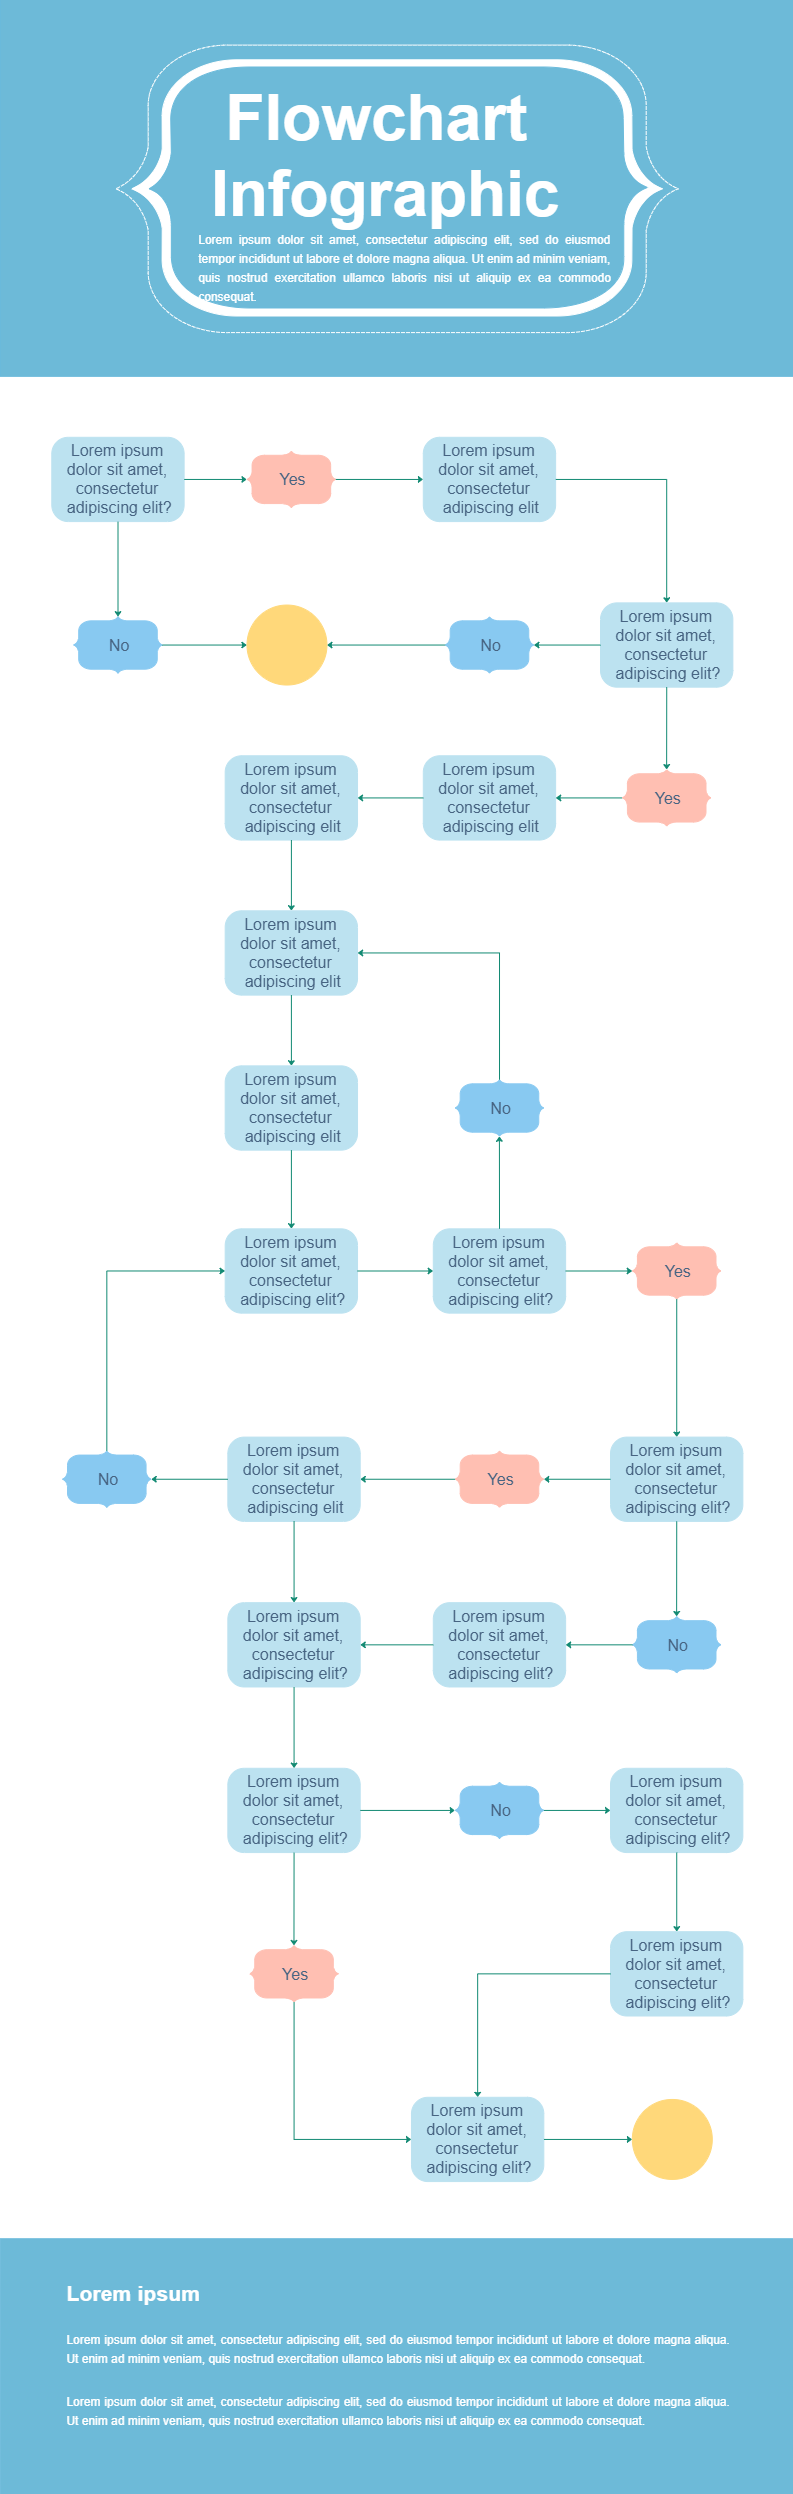
The most common Flowchart symbol is the rectangle which represents a process, operation, or task. The next common symbol is the diamond which is used to represent a decision. EdrawMax has pre-defined flowchart infographics that are highly customizable and can be used as per the requirement.
2. How to Create a Flowchart Infographic
Creating a flowchart in EdrawMax Online is pretty simple. The free flowchart maker has several features, like directly importing the data from the .csv file or creating one from scratch using free templates.
Step 1: Login EdrawMax Online
Log in EdrawMax Online using your registered email address. If this is your first time accessing the tool, you can create your personalized account from your personal or professional email address.
Step 2: Choose a template
EdrawMax Online comes with hundreds of free flowchart templates. Select a pre-designed template from the product based on your preference or need by selecting the "Flowchart" on the left navigation pane. It will open up several flowchart types. Alternatively, press "+" in EdrawMax Online canvas to create a flowchart from scratch.
Step 3: Customize the diagram
Customize your flowchart by changing the symbols and shapes as required. With the easy drag-and-drop feature of EdrawMax Online, you can use all the relative elements from libraries.
Step 4: Export & Share
Once your flowchart is completed, you can share it amongst your colleagues or clients using the easy export and share option. You can export a flowchart in multiple formats, like Graphics, JPEG, PDF, or HTML. Also, you can share the designs on different social media platforms, like Facebook, Twitter, LinkedIn, or Line.
3. Tips for Flowchart Infographic
A flowchart is a graphical or pictorial representation of an algorithm that uses symbols, shapes, and arrows to show how a process or program works. We can readily grasp a program thanks to algorithms. The fundamental goal of a flowchart is to compare and contrast different techniques.
Tag
flowchart
graph and chart
Graph Chart Collection
Share
Report
17
549

Post
Recommended Templates
Loading
