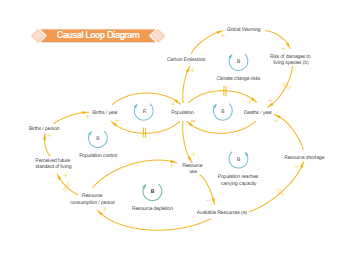
A causal loop diagram (CLD) is a causal diagram that aids in visualizing how different variables in a system are interrelated. Causal models can improve study designs by providing clear rules for deciding which independent variables need to be included/controlled for. As shown in the image below, a causal loop diagram consists of a set of nodes and edges -- where nodes represent the variables and edges are the links that represent a connection or a relation between the two variables. In the diagram, where the node in which the link starts decreases, the other node also decreases. At the same time, if the node in which the link starts increases, the other node increases as well. Instead of creating a causal loop diagram from scratch, try EdrawMax’s ready-to-use templates or use them as inspiration for your own design.


 Desktop