
Templates Community /
Cause And Effect Fishbone Diagram
Cause And Effect Fishbone Diagram
easy diagrams
Published on 2021-03-31


1. Introduction
2. What is Cause and Effect Diagram
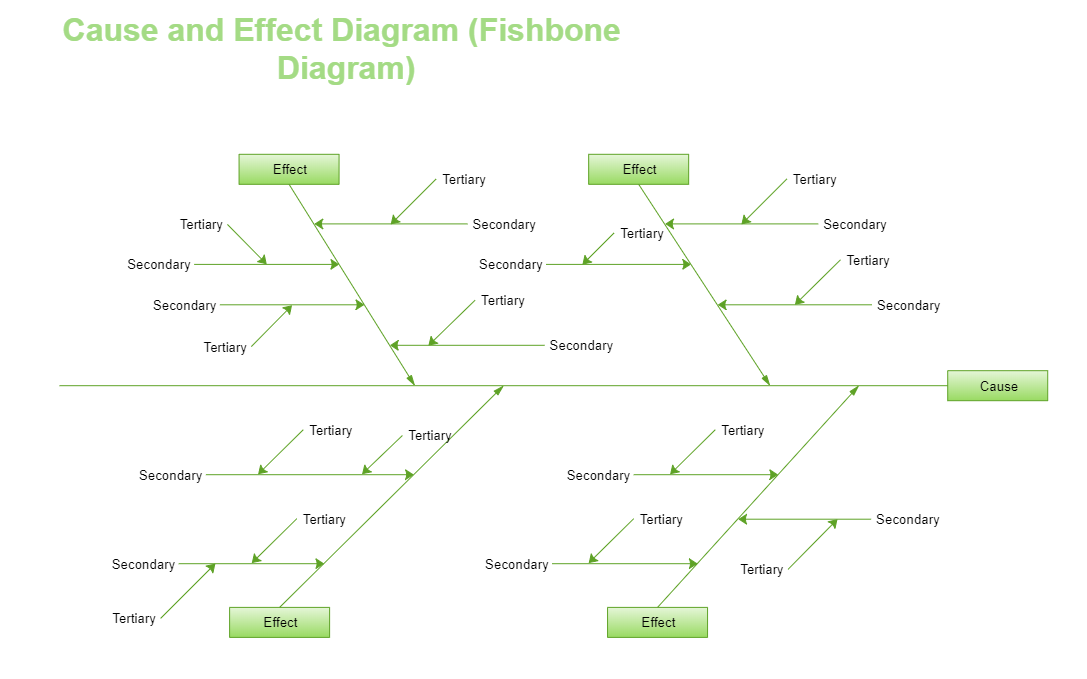
You can add ""bones"" to the fishbone diagram template and fill in the blanks with your data. That's all there is to it. The fillable Fishbone Diagram template below is a template that can be used to show cause and effect relationships. On any device - Internet, Mac, or Windows desktop - you can use a fillable Fishbone Diagram to build a fishbone diagram in minutes.
3. How to Create a Cause and Effect Diagram
Creating a Fishbone Diagram in EdrawMax Online is pretty simple. The free Fishbone Diagram maker has several features as you can instantly import the images or icons from your system or Google Drive or DropBox. With EdrawMax Online, you can also export your files that your colleagues can access on Android or iOS devices.
Login EdrawMax
Log in EdrawMax Online using your registered email address. If this is your first time accessing the tool, you can create your personalized account from your personal or professional email address.
Choose a template
EdrawMax Online comes with hundreds of free diagram templates. Select a pre-designed template by entering the Keyword in the ""Search"" section or exploring different diagram sets. In this case, you will find the Fishbone Diagrams under the ""Quality Management"" section under the ""Business"" diagram types. Alternatively, you can simply click on ""+"" in EdrawMax Online canvas to create a diagram of your preference.
Work on your research
You can add whatever content you require in a fillable fishbone diagram. Before that, you should gather all the correct information that you need to customize it.
Customize the diagram
Customize your Fishbone or Cause and Effect diagram by changing the color or by adding more relevant data.
Export & Share
Once your required Fishbone Diagram is completed, you can share it amongst your colleagues or clients using the easy export and share option. You can further export the diagram in multiple formats, like Graphics, JPEG, PDF, or HTML. Also, you can share the designs on different social media platforms, like Facebook, Twitter, LinkedIn, or Line.
Tag
fishbone
Mind Map Collection
Share
Report
15
1.5k

Post
Recommended Templates
Loading
