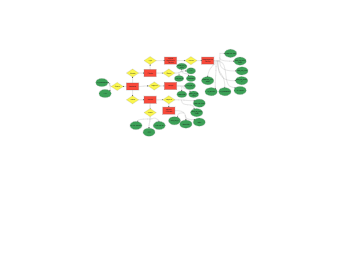
Here is a flowchart for deciding to develop an empirical equation. A flowchart is a diagrammatic representation of a process or workflow. This can be to represent an algorithm or showcase steps on how to solve a task. When getting started, rheological data from objective 1, then annular pressure losses determination. Learn more details from this flowchart, and try to make yours with ease.