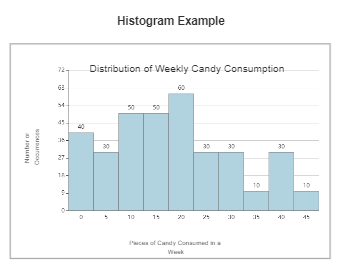
A frequency distribution shows how often each different value in a set of data occurs. A histogram is the most commonly used graph to show frequency distributions. Consumption Histograms template allows viewers to easily compare data of the distribution of weekly candy consumption. On the x-axis of the consumption histogram, there should be the quantity of candy, and on the y-axis, there should be the number of occurrences. A histogram works well with large ranges of information. They also provide a more concrete form of consistency, as the intervals are always equal, a factor that allows easy data transfer from frequency tables to histograms. As per the image, a consumption histogram is to graphically summarize the distribution of a univariate data set.