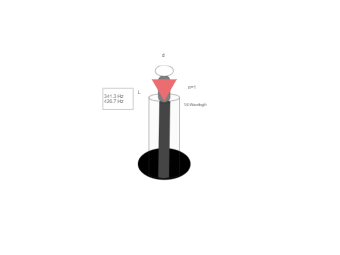
Here is a diagram of the science lab drawing. Science Diagrams are copies of technical data that are typically drawn by scientists, from the account of their practical observations and studies, such as biological dissections, chemical experiments, geological analysis, or exploration of mechanics. It is all for visualization, which makes knowledge sharing so much easier and faster.