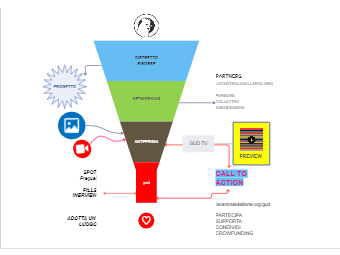
Here is a tunnel chart about the video spot. Funnel charts are often used to represent different stages in a sales or marketing process and show the amount of sales revenue or customer for each stage. A funnel chart is used to visualize different phases of a process. Learn more details from this diagram, try to make yours with ease.


 Desktop