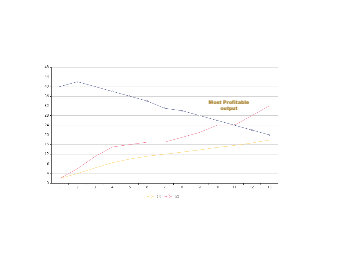
Here is a line graph showing the business's most profitable output. A line graph uses lines to connect data points that show quantitative values over a specified period. They indicate positive benefits on the horizontal x-axis and a vertical y-axis. Learn more details from this line graph, or try to make yours with ease.


 Desktop