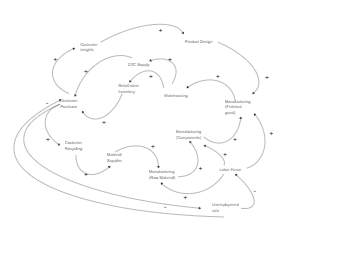
Here is a causal loop diagram example from which you can see how to flow worked. A causal loop diagram (CLD) is a causal diagram that aids in visualizing how different variables in a system are interrelated. The diagram consists of a set of nodes and edges. Nodes represent the variables and edges are the links that represent a connection or a relation between the two variables, learn more details from this diagram, or try to make yours with ease.


 Desktop