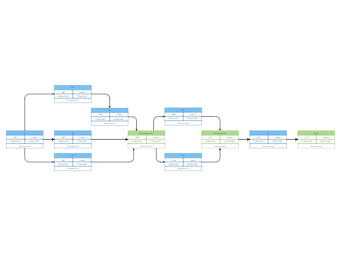
A Program Evaluation Review Technique (PERT) chart is a project management tool that provides a graphical representation of a project’s timeline. The PERT chart can be broken down into individual tasks for a project for analysis. The PERT chart example shows the process A1 that starts on day one and how the program evaluation moves forward for subsequent days and processes. A PERT chart is structured as a flow chart or network diagram that displays all the project tasks in separate boxes and connects them with arrows to clearly show task dependencies. In the PERT chart example, PERT calculates a weighted average by using a simple formula. EdrawMax and EdrawMax Online let you the best way to create PERT charts for any project.


 Desktop