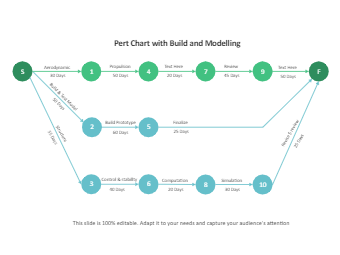
A Program Evaluation Review Technique (PERT) chart is a project management tool that provides a graphical representation of a project’s timeline. A PERT Chart example shows how the network diagram displays all the project tasks in separate boxes and connects them with arrows to clearly show task dependencies. The PERT chart with the build and modeling diagram shows the workflow of the project before the actual team starts working on it. The process starts with building a prototype, control, and stability, followed by the computation and simulation process. EdrawMax and EdrawMax Online let you the best way to create PERT charts for any project.