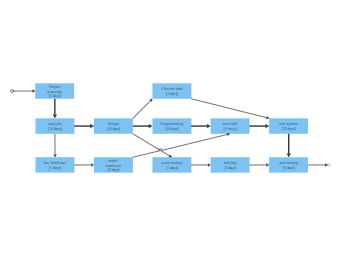
The best part of the User System PERT is its ability to integrate the uncertainty in project time estimations into its methodology. As the below user system image, the program evaluation and review technique breaks down the tasks into detailed activities. There are three estimation times involved in PERT: Optimistic Time Estimate, Most Likely Time Estimate, and Pessimistic Time Estimate. The chart shows the project breakdown into several stages like project planning, analysis, acquiring the hardware, and then working closely with the design time to make sure that there are no bugs. In the user PERT chart, these three estimated times are derived for each activity. This way, a range of time is given for each activity with the most probable value. Use EdrawMax to create a user system PERT chart diagram for your project.