
Template Community /
Probability Venn Diagram
Probability Venn Diagram
Lisa Anderson
Published on 2021-06-04

1. What is Probability Venn Diagram
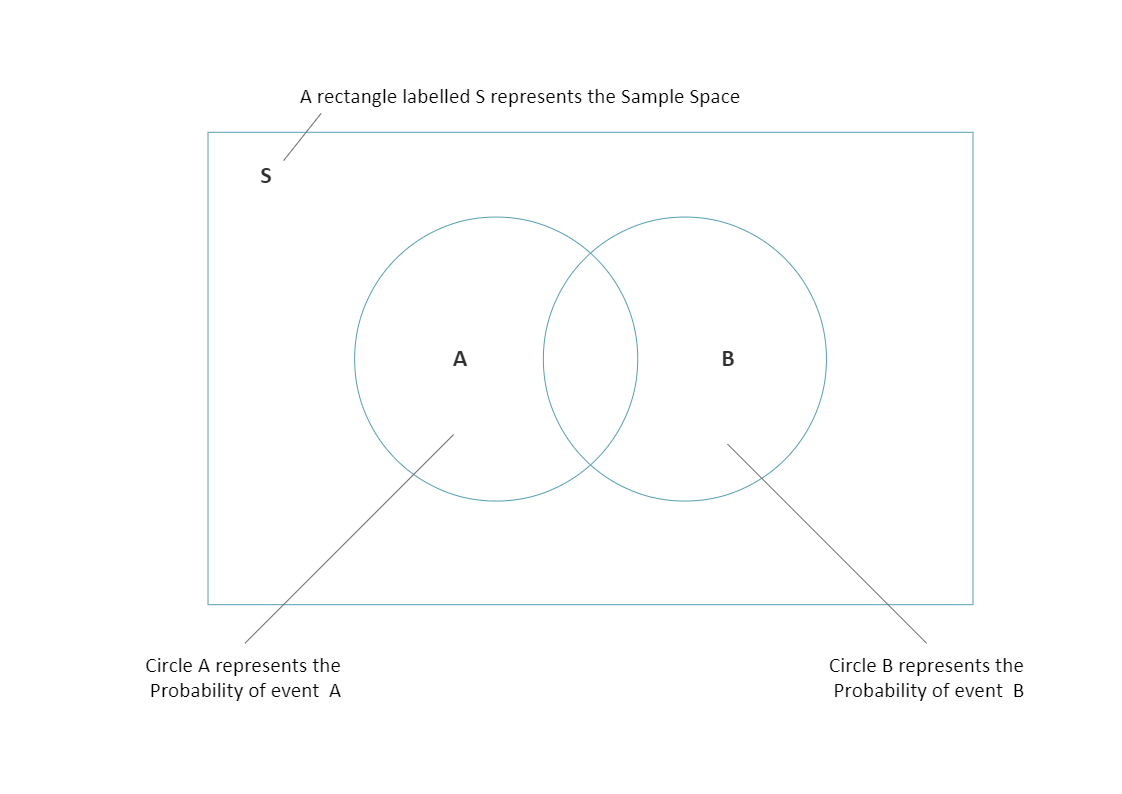
Probability is a repeatable process that gives outcomes, an event to show the collection of one or more outcomes, and a sample space to show all the possible results. As this Venn diagram shows, the circle A represents the Probability of event A, circle B shows the Probability of event B, and S represents the Sample Space.
2. How to Create a Venn Diagram
Creating a Venn Diagram in EdrawMax Online is pretty simple. The free Venn Diagram maker has several features, like directly importing your Google Drive or DropBox images.
Step 1:Login EdrawMax Online
Log in EdrawMax Online using your registered email address. If this is your first time accessing the tool, you can create your personalized account from your personal or professional email address.
Step 2:Choose a template
EdrawMax Online comes with hundreds of free Venn diagram templates. Select a pre-designed template from the panel by clicking on the ""General"" diagram type. It will open up the ""Basic"" diagram set. In this section, you will find the ""Venn Diagram."" Alternatively, press ""+"" in EdrawMax Online canvas to create a Venn Diagram from scratch.
Step 3:Work on your research
Every Venn Diagram consists of information about two or more entities. Get your proper research before you start customizing your Venn Diagrams.
Step 4:Customize the diagram
Customize your Venn Diagram by changing the symbols and shapes as required. With the easy drag-and-drop feature of EdrawMax Online, you can use all the relative elements from libraries.
Step 5:Export & Share
Once your Venn Diagram is completed, you can share it amongst your colleagues or clients using the easy export and share option. You can export the org chart diagram in multiple formats, like Graphics, JPEG, PDF, or HTML. Also, you can share the designs on different social media platforms, like Facebook, Twitter, LinkedIn, or Line.
3. Tips for Venn Diagram
The blank Venn diagram is a representation of three overlapping circles that reflect similarities or differences. Although different shapes can be used, mostly circles are used for creating these Venn diagrams. Every shape contains information about a particular set. The Venn diagram is also known as set diagrams or logic diagrams. It can be used across different fields like logic, mathematics, business, computer sciences, and linguistics. The Venn diagram can also be used in 3D presentations.
Tag
venn diagram
Venn Diagram Collection
education Venn Diagram
Share
Report
0
832

Post
Recommended Templates
Loading
