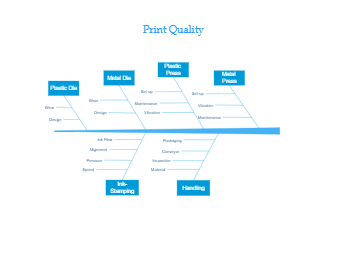
Here is a cause-and-effect diagram about print quality and production. In this diagram, there are different print methods are listed and compared. Ishikawa or fishbone diagram is one such diagram to detect the causes and effects of various imperfections, failures, or defects in the business. Managers mostly use the Ishikawa diagram or the cause and effect diagram as a tool in finding out the deviations that are necessary to detect for business expansion. Learn more details from this diagram, or try to make yours with ease now.


 Desktop