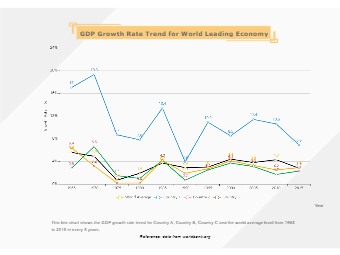
A Growth Domestic Product (GDP) growth rate trend for World Leading Economy shows the line chart depicting different GDPs of different countries. The below GDP growth rate line chart is customizable, and people can enter data as per the country’s need. In the below GDP growth rate line chart diagram, countries are sorted by nominal GDP estimates from financial and statistical institutions, which are calculated at market or government official exchange rates. A GDP growth rate line chart diagram represents an asset’s historical price action that connects a series of data points with a continuous line. Line Charts or Line Graphs are used to tracking changes over short and long periods. Create or customize the GDP growth rate line chart using EdrawMax.


 Desktop