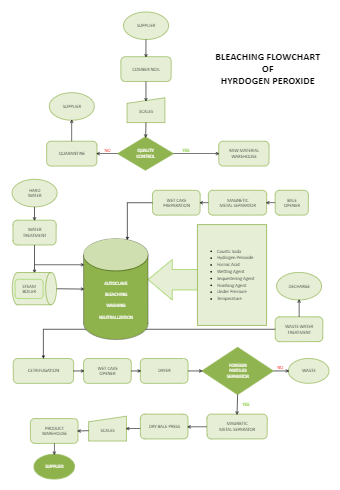
The bleaching flow chart of Hydrogen Peroxide shows the process of bleaching that starts and ends with a supplier. As the production diagram suggests, cotton fibers run through a processing machine that pulls the fibers apart. The cotton is moisturized, packed into cakes, and placed into kiers, large heated and pressurized vessels for the wet purification process. A continuous sodium hydroxide solution is pumped into the kiers for the cleaning process as they heat and pressurize. This process softens the fiber's natural waxes into water-soluble soaps and loosens any remaining debris. Once the scouring process is complete, the cakes are rinsed with fresh water. Following this, the process of oxidation in which hydrogen peroxide is used to eliminate color elements from the cotton, thus leaving the remaining microfibers white.


 Desktop