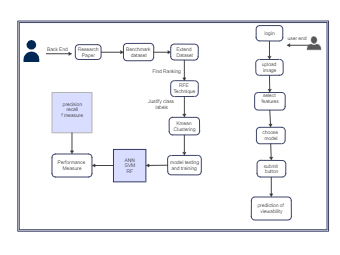
Here is a flowchart about the paper performance measurement from the back end and entrance end. As the name suggests, a Data Flow Diagram represents how data is passed through a system. To do this, it provides information about the input, output, and processes related to the system. In simple words, it depicts the flow between different entities in a system and how data is processed. Learn more details from this flowchart, and try to make yours with ease now.