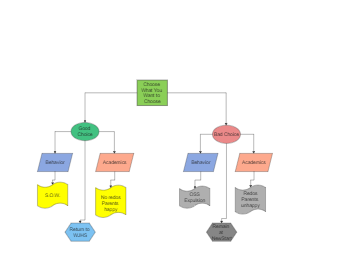
Natural Consequence Diagram graphically illustrates what you want to choose. There are two major aspects: Good Choice and Bad Choice. Good Choices can be a statement of work and no redos, and that's why parents are happy. Bad Choices can be out-of-school suspension, and redos will make parents unhappy. It should be noted here that a Cause Consequence Analysis (or Cause-Consequence Diagrams) is a method for illustrating the possible outcomes arising from the logical combination of selected input events or states. As the below natural consequence diagrams illustrate, the cause–consequence diagram technique has been applied to a static system and shown to yield the same result as those produced by the solution of the equivalent fault tree and binary decision diagram. On the basis of this, general rules have been devised for the correct construction of the cause–consequence diagram given a static system.