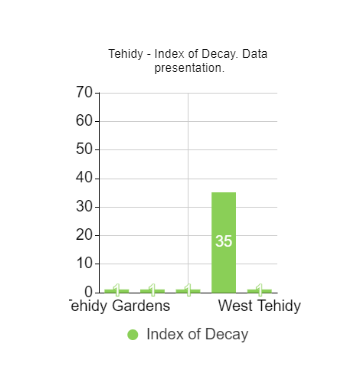
This is a simple column. Columns are simple to comprehend, extensively utilized, and capable of displaying changes over time. The purpose is to compare each category's values.
The goal is to make it as simple as possible for the spectator. Column charts are often the finest of all representations because they leverage into our natural capacity to understand heights, whereas most other data visualizations need the reader to learn how to decipher them.