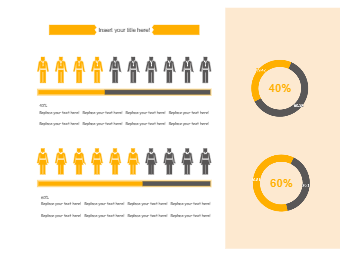
A percentage chart /graph is a graphical illustration of the relative changes that occur in a system. It displays the extent to which something has increased or decreased by comparing it to the original. The most basic application of the percentages chart is to compare one quantity against another, with the base set to 100%. A percentage chart can illustrate any data, but most commonly you will see them used with prices, economic indicators and many more. In this percentage chart, the ratio between the number of males and females is being shown. This can be used for calculating the ratio between the number of males and females in a society, community or in any profession and in many other ways. The following percentage chart has been drawn using EdrawMax Online. All the dummy text is replaceable, even the background colour, the Legend position, colour, position of label, label orientation can all be changed according to the requirement.