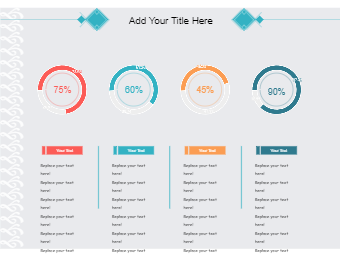
This is a Percentage chart. Here progress doughnut chart has been used to display the percentage of completion on a single metric. It shows the relationship of parts to a whole, but a doughnut chart can contain more than one data series. This type of chart provides more detail on the percentage change in a variable, such as sales, service level, production and many more. It can also be used for measuring the performance of any goal or target. A doughnut progress chart is a great way to display the data because it is very easy to understand. This is a perfect way to visually represent the data so that the reader can quickly see the progress of metrics. The following percentage chart/ doughnut progress chart has been drawn using EdrawMax Online. All the dummy text is replaceable, even the background colour. One can add more segments, doughnut thickness can also be changed according to the requirement.