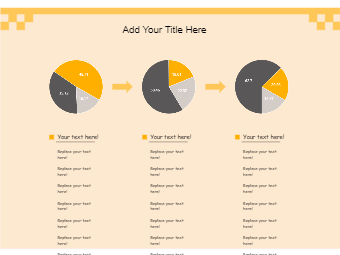
A pie chart is a circular statistical graphic, which is divided into slices to illustrate numerical proportion. In a pie chart, the arc length of each slice, is proportional to the quantity it represents. Pie charts are the most common type of chart and the name is derived as these appear like sliced piece of pie. They are used to show how a whole is divided into parts. Pie charts are used in many areas, such as retailing, transportation, in education and many more. This template is of pie chart has been drawn using EdrawMax Online. All the dummy text is replaceable, even the background colour and you can easily add or delete the pie slices in the pie chart, this intern changes the pie chart automatically. Instead of creating the charts from scratch, use EdrawMax online as it provides pre-defined templates, shapes, and figures which will help you create the pie chart with ease.