
Template Community /
Spider Chart - Autumn
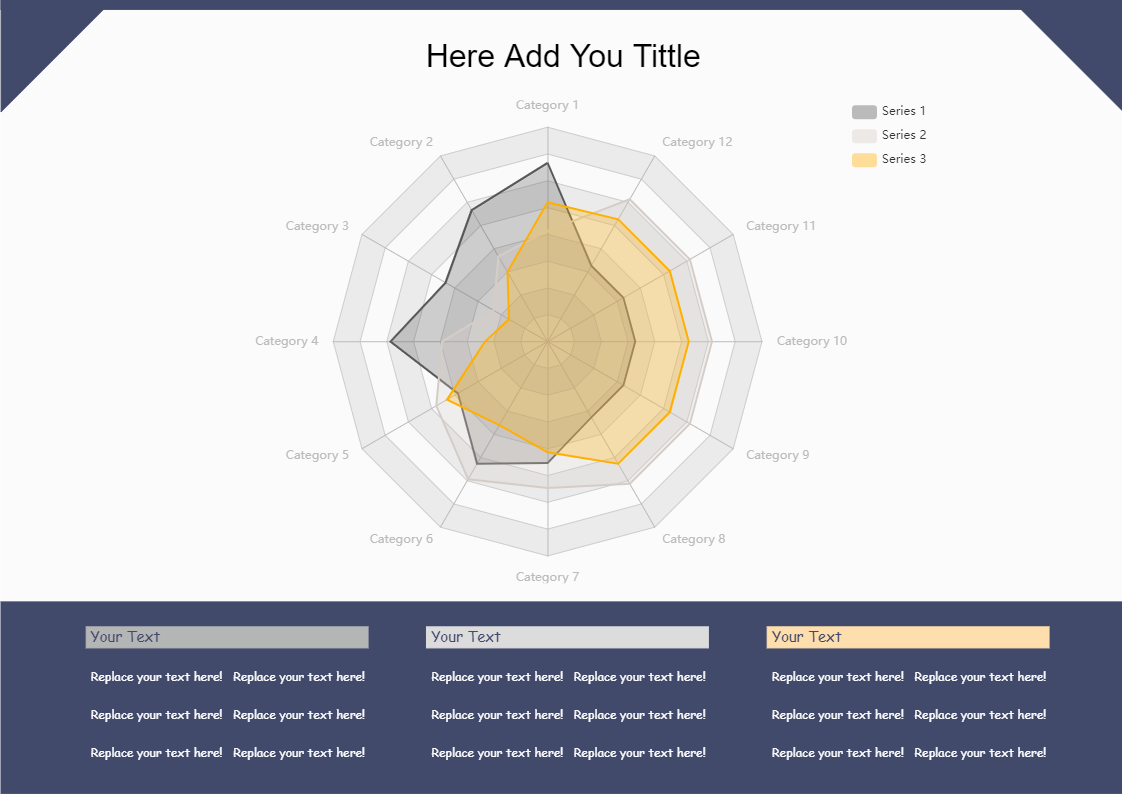
Spider Chart - Autumn
easy diagrams
Published on 2021-08-30

The spider chart (also called the radar chart, web chart, polar chart, and star plots) is named by its unique appearance. It is a type of data visualization that is typically used to show relationships between different variables that uses a two-dimensional graph to display a three-dimensional geometric shape connecting data points. It is most often used in the sciences and marketing to visualize the relationships between different pieces of information. Spider charts are easy to understand because they are simple and easy-to-interpret charts. This template has three categories/ series that have been compared with each other with the help of 12 data points/ parameters. This will help one to analyse how each of the categories/ series is compared against one another. And also, EdrawMax lets you import or export data from an excel file, allows you to change the chart type, legend and label position, series, coordinate shape, and increase or decrease the number of segments.
Tag
graph and chart
spider chart
Graph Chart Collection
Share
Report
2
326

Post
Recommended Templates
Loading
