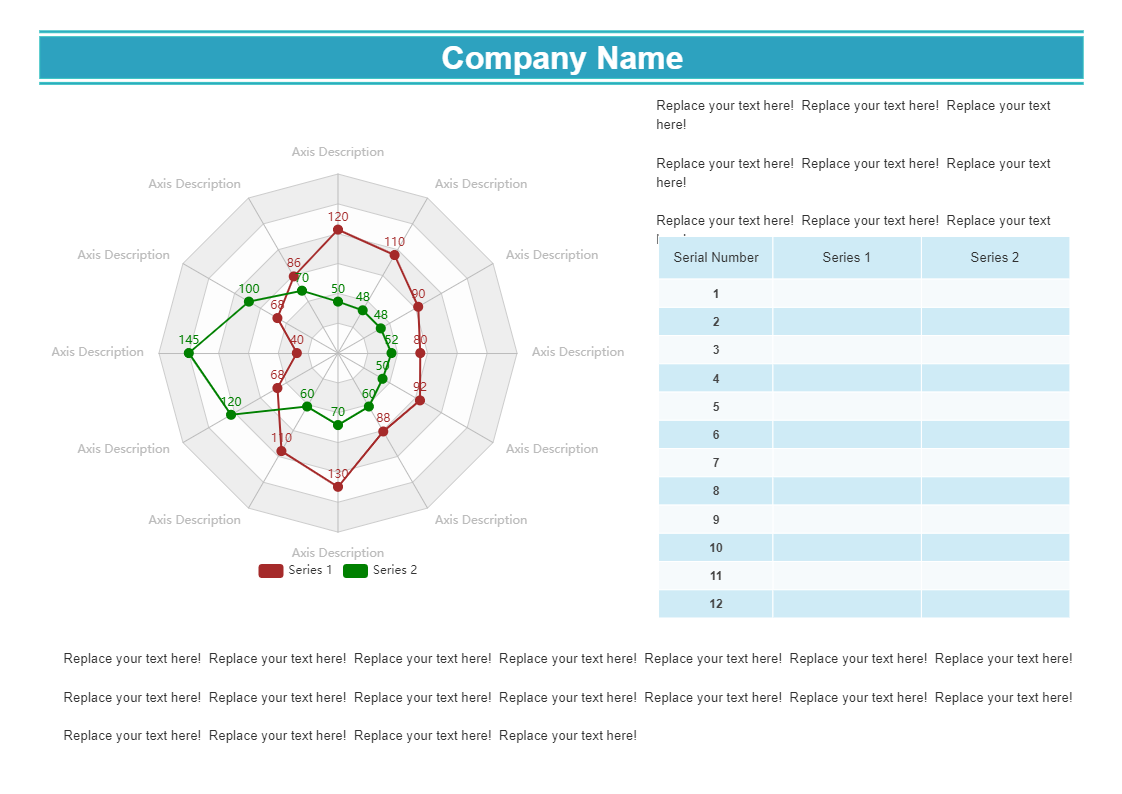
A spider chart is an infographic chart that illustrates the relationships between different variables and also connections between different data. It’s often used for comparing features or data points from different items. Spider charts have been most commonly seen in comparing computer hardware, but they can be used to compare anything from fashion brands to test scores. This template has two categories /series of red and green colour are compared with each other with the help of 12 data points (parameters). There is also a place to add details of parameters and categories in the template. All the dummy text is replaceable, even the background colour and border, and you can easily add or delete the series or data points, this intern changes the spider chart. And also, EdrawMax lets you import or export data from an excel file, allows you to change the chart type, legend and label position, series and coordinate shape, and increase or decrease the number of segments.


 Desktop