
Templates Community /
Compare and Comtrast Graphic Organzier
Compare and Comtrast Graphic Organzier
easy diagrams
Published on 2021-09-16

 Desktop

1. Introduction
2. What is Graphic Organzier
A graphic organizer is a teaching and learning tool for organizing information and concepts in an easy-to-understand and internalize style. Graphic organizers show relationships and connections between concepts, phrases, and facts by combining text and graphics.
Graphic organizers can be utilized in all grades and have been shown to be effective learning tools for gifted students and students with special needs. Graphic organizers can also assist adult learners in making connections between what they currently know and newly acquired knowledge.
3. How to Create a Compare and Contrast Graphic Organizer
Creating a graphic organizer chart in EdrawMax Online is pretty simple. The free graphic organizer maker has several features, like directly importing the data from the .csv file or creating one from scratch using free templates.
Step 1: Login EdrawMax Online
Log in EdrawMax Online using your registered email address. If this is your first time accessing the tool, you can create your personalized account from your personal or professional email address.
Step 2: Choose a template
EdrawMax comes with hundreds of free graphic organizer templates. Select a pre-designed template from the product based on your preference or need by selecting the ""Education"" on the left navigation pane. It will open up several graphic organizer types, like T-chart, main idea diagram, and more. Alternatively, press ""+"" in EdrawMax Online canvas to create a graphic organizer from scratch.
Step 3: Customize the diagram
Customize your graphic organizer by changing the symbols and shapes as required. With the easy drag-and-drop feature of EdrawMax Online, you can use all the relative elements from libraries.
Step 4: Export & Share
Once your graphic organizer is completed, you can share it amongst your colleagues or clients using the easy export and share option. You can export a graphic organizer in multiple formats, like Graphics, JPEG, PDF, or HTML. Also, you can share the designs on different social media platforms, like Facebook, Twitter, LinkedIn, or Line.
4. Key Takeaways
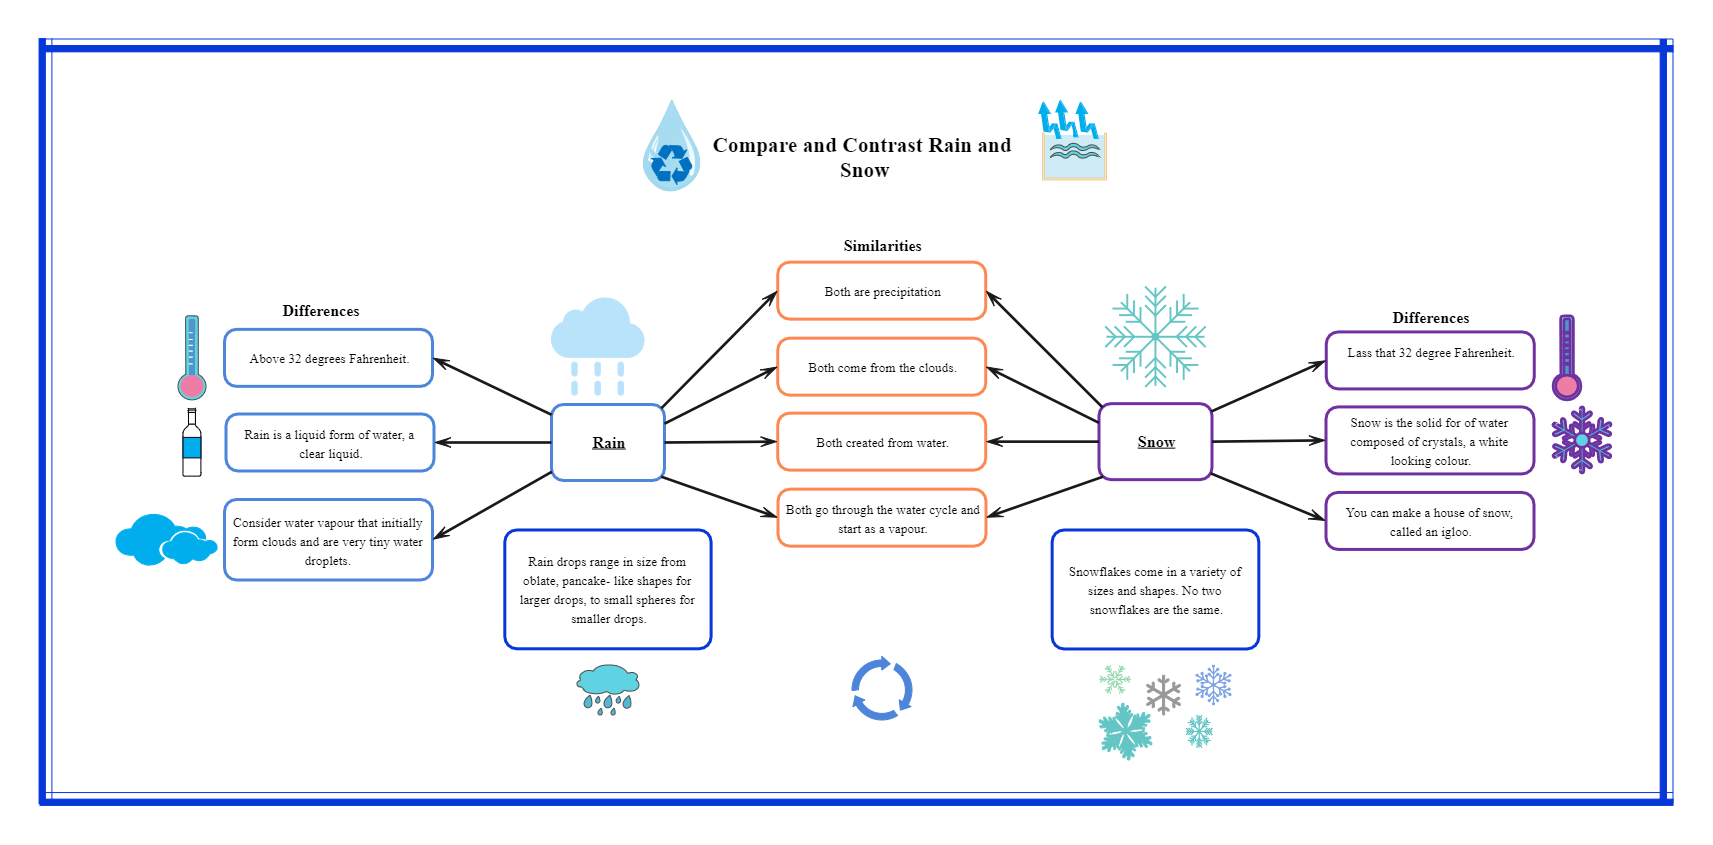
Students can use this organizer to illustrate the similarities and contrasts between two things or ideas. Following the completion of this organizer, the material gained might easily be turned into a classroom discussion or writing topic.
Give kids two things to compare and contrast, and have them brainstorm what they have in common and what they have in common. Students can develop lists of their ideas or talk about them with a partner or in a group. Allow students to share their ideas with the rest of the class so that they can compare and contrast different ideas that they may not have considered.
Tag
Compare Contrast Graphic Organizer
Graphic Organizer Collection
Share
Report
15
1.4k

Post
Recommended Templates
Loading
