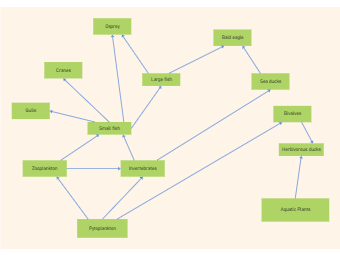
The diagram usually consists of circles representing an element that influences the problem. Connecting lines are used to represent the relationship between elements. The analysis required for making an interrelationship diagram involves six steps. Even though the tool does not provide detailed reasons for the problem, diagrams demonstrate the relationships between causes and consequences in a clear way. A minimal food web model was constructed comprising one grazing and one detritus food chain coupled by nutrient cycling and generalist carnivores to investigate how prey preference by carnivores may affect the strength of trophic cascades across a gradient of nutrient enrichment.


 Desktop