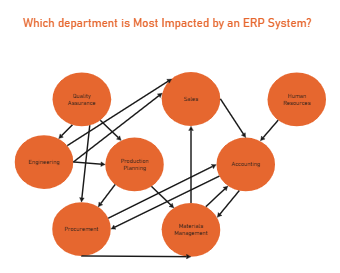
An Interrelationship Diagram graphically shows the cause-and-effect relationships among a group of items, issues, problems, or opportunities. It is particularly useful in helping to identify the potential causal relationships that might lie behind a problem that continues to recur despite attempts to resolve it. ERPs are databases used in large businesses to organize information and create reports across multiple departments. In the example below, the team has drawn their arrows. Team members begin to see which departments are drivers or outcomes. The concepts with only arrows going out are considered drivers, and those with only arrows coming in are considered an outcome. With that said, we find there is only one true driver: Quality Assurance. All other departments are nested between causes and effects.


 Desktop