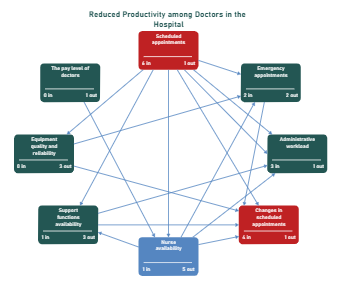
Reduced productivity among doctors in the government or private hospitals can be graphically illustrated using the interrelationship diagram designed using EdrawMax. The reasons for the reduction in productivity could be an increase in scheduled appointments (6:1 ratio for in-out), emergency appointments (2:2 ratio for in-out), administrative workload (3:1 ratio for in-out), changes in scheduled appointments (4:1 ratio for in-out), nurse availability (1:5 ratio for in-out), support functions availability (1:3 ratio for in-out), equipment quality and reliability (0:3 ratio for in-out), and the pay level of doctors (0:1 ratio for in-out).


 Desktop