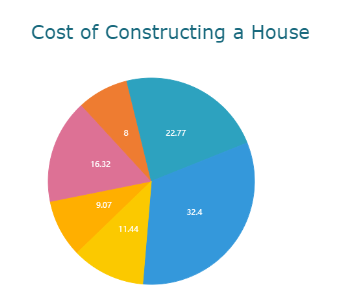
A Pie chart is a type of graph that represents the data in a circular format. The slices of pie show the relative size of the data in the provided condition. The cost of constructing a house can be broken down using a pie chart to understand the budget allocation and which resources need extra effort.