A line plot or line chart is a type of chart that displays information as a series of data points called markers that are connected by a straight line. There are different types of Line Charts:
Line Chart: This chart depicts the trend over time or different categories.
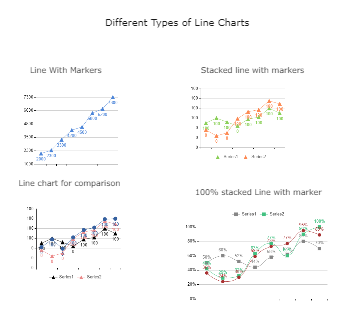
Line Chart with markers: This is similar to the Line Chart, but here, the main events are denoted using markers.
Stacked Line Chart: We use a stacked line chart where there are lines of the data points that don’t overlap because all the points will be cumulative at each end.
Stacked Line Chart with Markers: This is similar to the stacked line chart, but we use markers to denote the key events or categories.
100% stacked Line Chart: This visually represents the percentage contribution to a whole-time.
100% Stacked Line Chart with Markers: This is similar to the 100% Stacked Line Chart, where we use the percentage contribution, but data points will be highlighted with markers.


 Desktop