
Templates Community /
Python Bar Chart
Python Bar Chart

Adithya Krishnan
Published on 2021-09-28

 Desktop

1. Introduction
2. What is Python Bar Chart
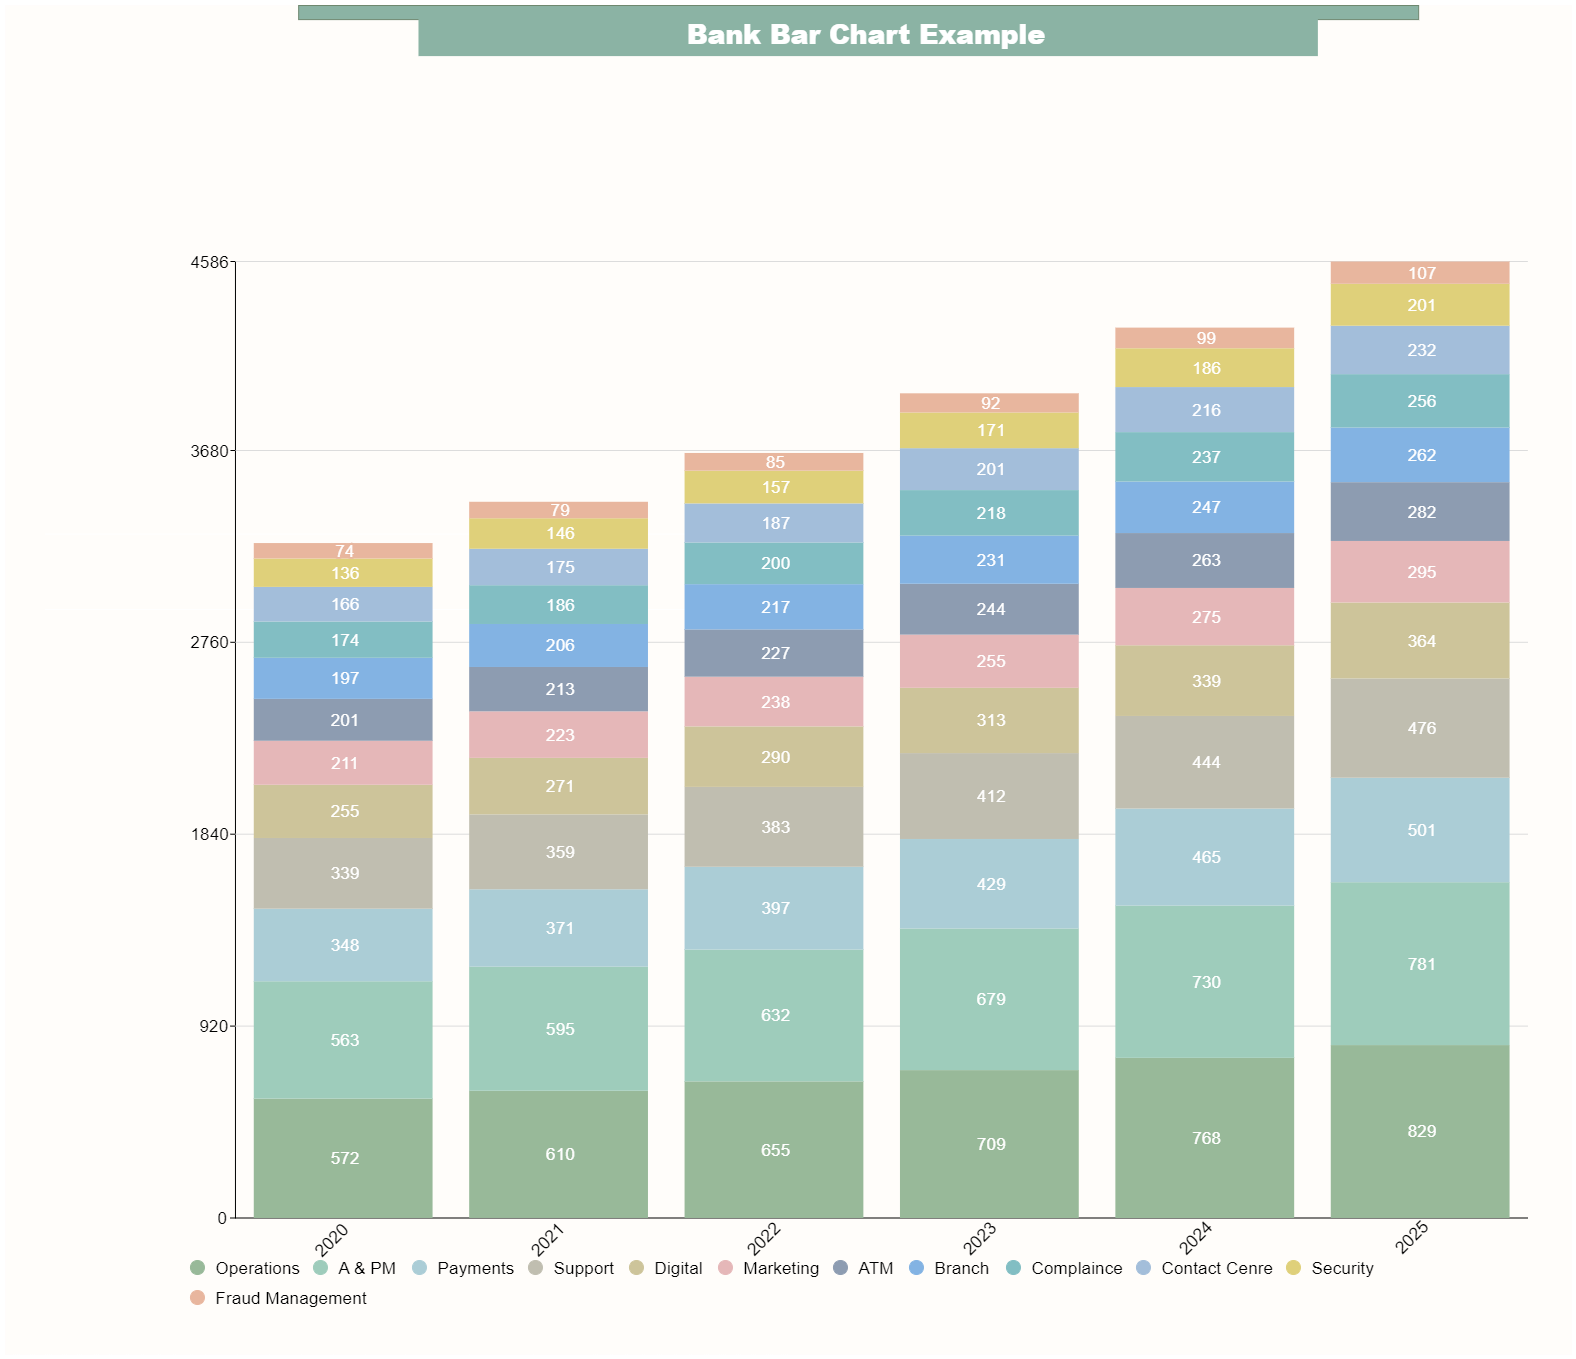
A bar chart or bar graph is a chart or graph that uses rectangular bars with heights or lengths proportional to the values they represent to convey categorical data. The bars can be plotted either horizontally or vertically.
Comparisons between discrete categories are shown in a bar graph. The chart's one axis depicts the precise categories being compared, while the other indicates a numerical value.
3. How to Create a Python Bar Chart
Creating a chart in EdrawMax is pretty simple. The free chart maker has several features, like directly importing the data from the .csv file or creating one from scratch using free templates.
Step 1: Login EdrawMax
Log in EdrawMax using your registered email address. If this is your first time accessing the tool, you can create your personalized account from your personal or professional email address.
Step 2: Choose a template
EdrawMax Online comes with hundreds of free chart templates. Select a pre-designed template from the product based on your preference or need by selecting the "Graph and Chart" on the left navigation pane. It will open up several chart types. Alternatively, press "+" in EdrawMax Online canvas to create a card from scratch.
Step 3: Customize the diagram
Customize your chart by changing the symbols and shapes as required. With the easy drag-and-drop feature of EdrawMax Online, you can use all the relative elements from libraries.
Step 4: Export & Share
Once your chart is completed, you can share it amongst your colleagues or clients using the easy export and share option. You can export a chart in multiple formats, like Graphics, JPEG, PDF, or HTML. Also, you can share the designs on different social media platforms, like Facebook, Twitter, LinkedIn, or Line.
Tag
graph and chart
Graph and Chart Collection
Share
Report
5
777

Post
Recommended Templates
Loading
